Multiple Choice
 Assume the market depicted in the graph is in equilibrium at demand (D) and supply (S1) . Total surplus is:
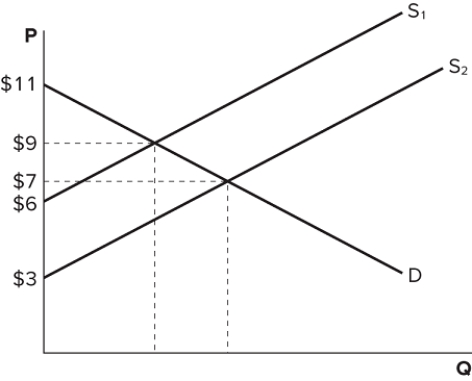
A) greater than it is when the market is in equilibrium at D and S2.
B) less than it is when the market is in equilibrium at D and S2.
C) the same as it is when market is in equilibrium at D and S2.
D) zero.
Correct Answer:

Verified
Correct Answer:
Verified
Q102: A market to buy and sell organs:<br>A)
Q103: <img src="https://d2lvgg3v3hfg70.cloudfront.net/TB8194/.jpg" alt=" Assume the market
Q104: The willingness to pay of buyers in
Q105: If a market is missing:<br>A) deadweight loss
Q106: <img src="https://d2lvgg3v3hfg70.cloudfront.net/TB8194/.jpg" alt=" Assume the market
Q108: A market has four individuals, each considering
Q109: A market has four individuals, each considering
Q110: <img src="https://d2lvgg3v3hfg70.cloudfront.net/TB8194/.jpg" alt=" Assume the market
Q111: <img src="https://d2lvgg3v3hfg70.cloudfront.net/TB8194/.jpg" alt=" Assume the market
Q112: For which of the following reasons might