Multiple Choice
 Suppose the graph shown depicts the demand for a normal good. A shift from A to B might be caused by:
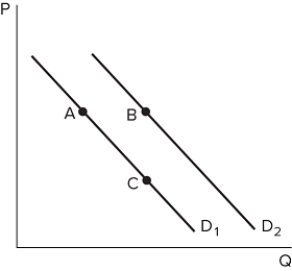
A) an increase in price.
B) a decrease in price.
C) an increase in income.
D) a decrease in income.
Correct Answer:

Verified
Correct Answer:
Verified
Q90: Which of the following would not affect
Q91: A demand curve is a graph that:<br>A)
Q92: A decrease in the price of spaghetti
Q93: <img src="https://d2lvgg3v3hfg70.cloudfront.net/TB8194/.jpg" alt=" The graph shown
Q94: <img src="https://d2lvgg3v3hfg70.cloudfront.net/TB8194/.jpg" alt=" The graph shown
Q96: Juan goes to his favorite store to
Q97: Equilibrium takes place where:<br>A) supply and demand
Q98: <img src="https://d2lvgg3v3hfg70.cloudfront.net/TB8194/.jpg" alt=" The table shown
Q99: The law of supply is described as
Q100: Ren loves to go to the movie