Multiple Choice
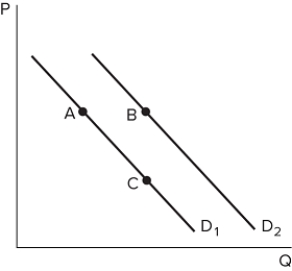 Suppose the graph shown depicts the demand for a normal good. Pasua was originally consuming at point A, but after receiving a raise at work her demand may:
A) be unaffected.
B) increase to point B.
C) increase to point C.
D) drop to zero.
Correct Answer:

Verified
Correct Answer:
Verified
Related Questions
Q14: The term market refers to:<br>A) a physical
Q15: Suppose a lawn care company adopts a
Q16: When quantity supplied equals quantity demanded:<br>A) equilibrium
Q17: After getting a raise at work, Gustavo
Q18: Consider the market for pecans, which is
Q20: Suppose the price of oil has recently
Q21: A news report states that the housing
Q22: An increase in the price of butter
Q23: In a _ economy, private individuals (as
Q24: Due to above-average rainfall last year there