Multiple Choice
 In the market shown in the graph, the equilibrium price is:
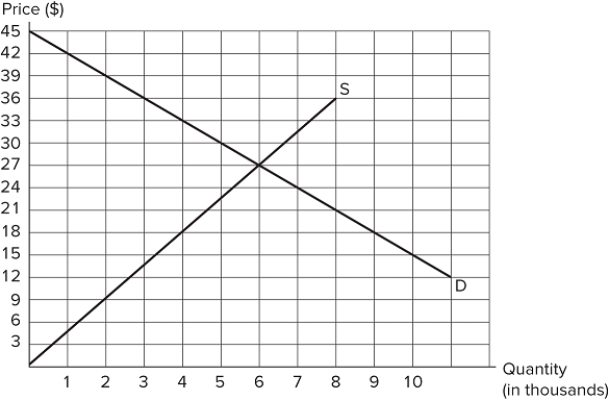
A) $6.
B) $27.
C) $36.
D) $12.
Correct Answer:

Verified
Correct Answer:
Verified
Related Questions
Q127: Demand describes how much of something people:<br>A)
Q128: Which of the following is not a
Q129: A decrease in the price of ice
Q130: The most likely substitute good for cereal
Q131: <img src="https://d2lvgg3v3hfg70.cloudfront.net/TB8194/.jpg" alt=" The table shows
Q133: What are transaction costs?<br>A) The costs incurred
Q134: Consider the market for tacos. To figure
Q135: <img src="https://d2lvgg3v3hfg70.cloudfront.net/TB8194/.jpg" alt=" The graph shown
Q136: Suppose the price of chocolate chips increases.
Q137: <img src="https://d2lvgg3v3hfg70.cloudfront.net/TB8194/.jpg" alt=" The graph shown