Multiple Choice
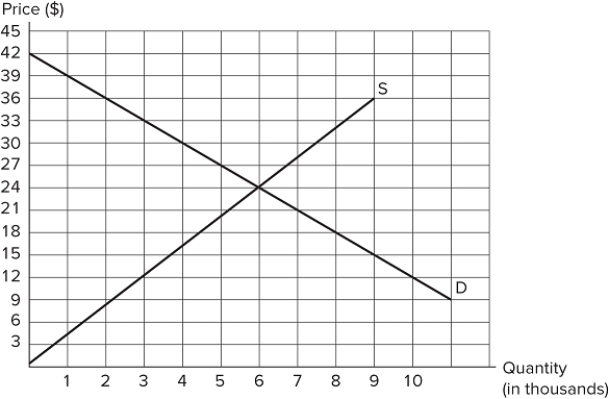 The graph shown depicts the market for a good. At a price of $12, there is:
A) a surplus (excess supply) of 10,000 units.
B) a shortage (excess demand) of 10,000 units.
C) a shortage (excess demand) of 7,000 units.
D) a surplus (excess supply) of 3,000 units.
Correct Answer:

Verified
Correct Answer:
Verified
Q45: Suppose there is an unusually large crop
Q46: <img src="https://d2lvgg3v3hfg70.cloudfront.net/TB8194/.jpg" alt=" The table shown
Q47: The most likely substitute good for hot
Q48: An article about how coffee boosts critical
Q49: <img src="https://d2lvgg3v3hfg70.cloudfront.net/TB8194/.jpg" alt=" Suppose the graph
Q51: When does a surplus occur?<br>A) When the
Q52: A perfectly competitive market is one in
Q53: Which of the following statements describes a
Q54: A table that shows the quantities of
Q55: The point at which buyers and sellers