Multiple Choice
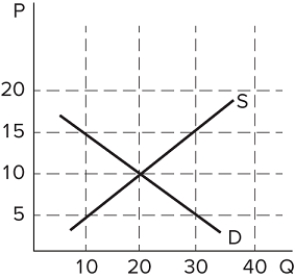 The graph shown depicts the market for a good. What state is this market in if the price of the good is $15?
A) There is a shortage (excess demand) , signaling that sellers should raise their price.
B) There is a shortage (excess demand) , signaling that buyers should leave the market.
C) There is a surplus (excess supply) , signaling that sellers should drop their price.
D) There is a surplus (excess supply) , signaling that buyers should bid up the price.
Correct Answer:

Verified
Correct Answer:
Verified
Q55: The point at which buyers and sellers
Q56: The demand curve:<br>A) represents consumers' willingness, but
Q57: On the first day of school, Jackie
Q58: Which of the following statements about the
Q61: What happens to the demand curve when
Q62: For almost all goods, the:<br>A) lower the
Q63: With the baby boomer generation hitting the
Q64: Suppose a tornado levels hundreds of homes.
Q65: Ceteris paribus is:<br>A) the Latin term for
Q77: Suppose the advancement of computers has decreased