Multiple Choice
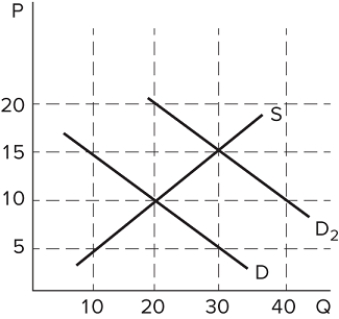 The graph shown depicts the market for a good. Assume the market was originally in equilibrium where the demand curve (D) and supply curve (S) intersect. What was the original equilibrium price and quantity for this good?
A) $5 and 30
B) $5 and 20
C) $10 and 20
D) $20 and 10
Correct Answer:

Verified
Correct Answer:
Verified
Q148: A demand schedule is a _ that
Q149: The buyers and sellers who trade a
Q150: The law of supply states that, all
Q151: Suppose the price of house paint, a
Q152: Suppose the price of oil has recently
Q154: <img src="https://d2lvgg3v3hfg70.cloudfront.net/TB8194/.jpg" alt=" The table shows
Q155: A table that shows the quantities of
Q156: As part of recent cutbacks at his
Q157: <img src="https://d2lvgg3v3hfg70.cloudfront.net/TB8194/.jpg" alt=" The table shows
Q158: If a producer incorrectly sets the price