Multiple Choice
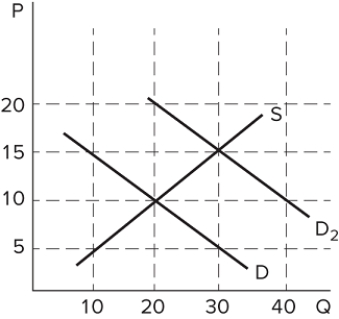 The graph shown depicts the market for a good. Assume the market was originally in equilibrium where the demand curve (D) and supply curve (S) intersect. Something changes in the market, and the demand curve for the good shifts to D2. Which of the following is true?
A) The equilibrium price will increase by $5.
B) The equilibrium quantity will increase by 20 units.
C) The equilibrium price will increase by $15.
D) The equilibrium quantity will increase by 30 units.
Correct Answer:

Verified
Correct Answer:
Verified
Q121: The supply curve represents the relationship between
Q122: Consider the market for burritos, which is
Q123: Perfectly competitive markets are:<br>A) the most common
Q124: The "Made in the USA" campaign was
Q125: <img src="https://d2lvgg3v3hfg70.cloudfront.net/TB8194/.jpg" alt=" The table shown
Q127: Demand describes how much of something people:<br>A)
Q128: Which of the following is not a
Q129: A decrease in the price of ice
Q130: The most likely substitute good for cereal
Q131: <img src="https://d2lvgg3v3hfg70.cloudfront.net/TB8194/.jpg" alt=" The table shows