Multiple Choice
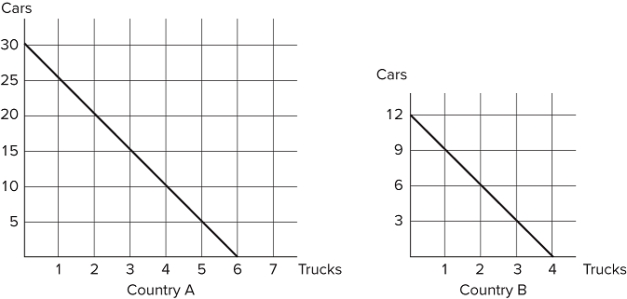 Refer to the figure shown, which represents the production possibilities frontiers for Countries A and B. The slope of Country A's production possibilities frontier:
A) measures the opportunity cost of trucks in terms of cars.
B) measures the trade-off that Country A faces when deciding how to allocate resources.
C) is constant, because the opportunity cost remains constant.
D) All of these statements are true.
Correct Answer:

Verified
Correct Answer:
Verified
Q109: Suppose that a worker in Country A
Q110: Suppose an American worker can make 50
Q111: A production possibilities frontier is a line
Q112: Tom and Jerry have one day to
Q113: What limits the terms of trade that
Q115: Economic theory states that losing a comparative
Q116: Suppose that a worker in Country A
Q117: The slope of a production possibilities frontier
Q118: Suppose that a worker in Country A
Q119: Tom and Jerry have one day to