Multiple Choice
The graph shown displays various price and output levels in an economy. 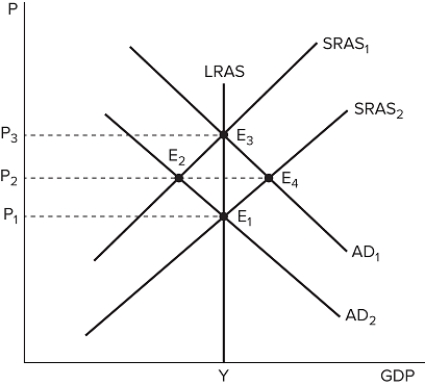 What does the "Y" on the x-axis stand for?
A) Full employment level of output
B) Current level of GDP
C) Observed level of output
D) Future target goal for output
Correct Answer:

Verified
Correct Answer:
Verified
Related Questions
Q89: If an economy produces 3,000 units of
Q90: According to the quantity theory of money,
Q91: Deflation is a problem because it:<br>A) increases
Q92: Which of the following is not associated
Q93: Applying contractionary monetary policy when the inflation
Q95: Which of these is not a reason
Q96: The classical theory of inflation illustrates the
Q97: If the nominal interest rate is higher
Q98: If an economy produces 2,500 units of
Q99: Suppose the annual nominal interest rate is