Multiple Choice
The graph shown displays various price and output levels in an economy. 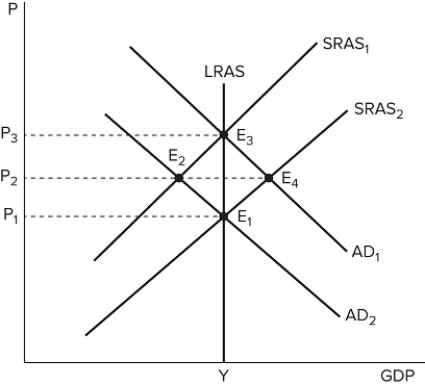 Which point on the graph shown would represent an economic expansion?
A) E 1
B) E 2
C) E 3
D) E 4
Correct Answer:

Verified
Correct Answer:
Verified
Related Questions
Q28: When an economy experiences deflation, consumption decreases
Q29: If the real rate of return is
Q30: The inability to conduct expansionary monetary policy
Q31: Suppose the annual nominal interest rate is
Q32: The _ price level is a measure
Q34: If the Fed were to push unemployment
Q35: Deflation _consumption and investment, which _.<br>A) decreases;
Q36: Subtracting the inflation rate from the nominal
Q37: Deflation is a:<br>A) sustained fall in the
Q38: When interest rates are already at zero