Multiple Choice
The graph shown displays various price and output levels in an economy. 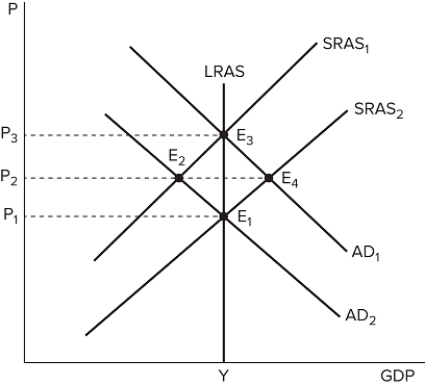 If the economy is currently at point E1, it must be in:
A) long-run equilibrium.
B) a recession.
C) an economic boom.
D) an economic recovery.
Correct Answer:

Verified
Correct Answer:
Verified
Related Questions
Q13: Brian is paid monthly via a direct
Q14: The graph shown displays various price and
Q15: If the nominal interest rate is the
Q16: What is the quantity equation?<br>A) M ×
Q17: A temporary change in the price level
Q19: Neutrality of money is the idea that:<br>A)
Q20: The graph shown displays various price and
Q21: An overall rise in prices is called:<br>A)
Q22: When the Fed conducts expansionary monetary policy,
Q23: The quantity equation implies that any decrease