Multiple Choice
The graph shown displays various price and output levels in an economy. 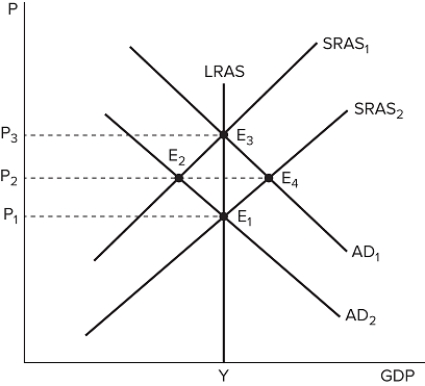 If the economy is currently at point E2, the Fed is most likely to undertake _______ monetary policy because it will shift _______.
A) expansionary; AD to the right
B) contractionary; AD to the left
C) expansionary; AD to the left
D) contractionary; AS to the right
Correct Answer:

Verified
Correct Answer:
Verified
Q57: The lowest possible unemployment rate that will
Q58: When an economy is producing at its
Q59: According to the quantity theory of money,
Q60: If the Fed were to allow unemployment
Q61: During the 1980s, Federal Reserve Chairman Paul
Q63: Which country has struggled with a liquidity
Q64: Because it excludes food and energy prices,
Q65: If we know values for the money
Q66: Disinflation is a period during which overall
Q67: The NAIRU:<br>A) is difficult to measure.<br>B) can