Multiple Choice
The graph shown displays various economic outcomes. 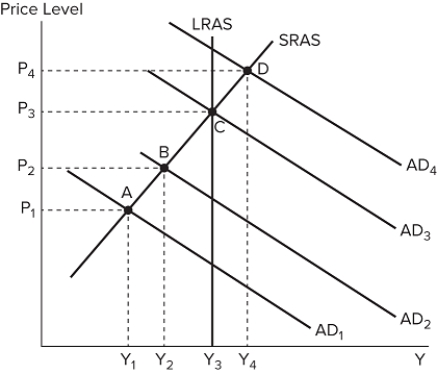 At which equilibrium would the government most likely decide to increase its spending?
A) Point C
B) Point A
C) Point D
D) This cannot be answered without more information.
Correct Answer:

Verified
Correct Answer:
Verified
Q17: The government budget includes money:<br>A) coming in
Q18: Fiscal policy is often difficult to successfully
Q19: The table shown displays information about a
Q20: Who buys U.S. Treasury securities? I. U.S.
Q21: If the government wished to shift aggregate
Q23: Ricardian equivalence will fail to hold if:<br>A)
Q24: Consumption depends on:<br>A) total income.<br>B) disposable income.<br>C)
Q25: The graph shown displays various economic outcomes.
Q26: If interest rates increase, the debt becomes:<br>A)
Q27: Economists express the budget deficit:<br>A) as a