Multiple Choice
The figure shows planned aggregate expenditure and output for an economy. 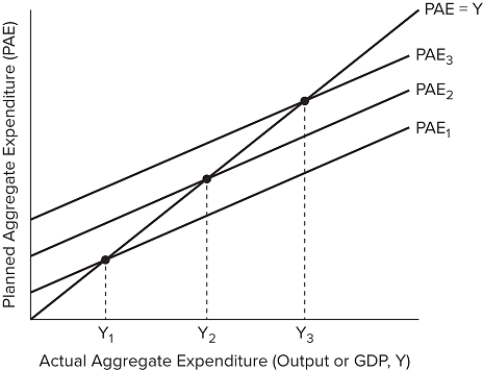 Suppose that the economy starts at PAE2. Which change would cause a move from PAE2 to PAE1?
A) The wealth level decreases.
B) Interest rates decrease.
C) The expected profitability of investments increase.
D) Domestic income decreases.
Correct Answer:

Verified
Correct Answer:
Verified
Q20: If the government wishes to increase GDP
Q21: If PAE is greater than Y, we
Q22: If the government wishes to increase GDP
Q23: If the MPC is 0.8, and the
Q24: Foreign income is earned:<br>A) by a nation's
Q26: The figure shows planned aggregate expenditure and
Q27: The Keynesian equilibrium occurs when:<br>A) planned inventories
Q28: Which of the following is a determinant
Q29: The spending multiplier tells us the amount
Q30: The real exchange rate generally has a