Multiple Choice
The figure shows planned aggregate expenditure and output for an economy. 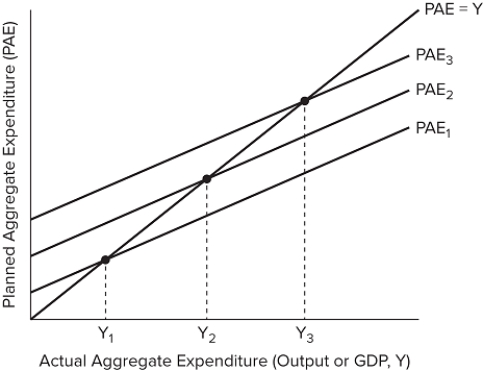 Suppose that the economy starts at PAE2. Which change would cause a move from PAE2 to PAE1?
A) The wealth level increases.
B) Interest rates increase.
C) Taxes decrease.
D) Domestic income decreases.
Correct Answer:

Verified
Correct Answer:
Verified
Q97: In order to accurately capture the multiplier
Q98: Actual investment is the:<br>A) spending households engage
Q99: Autonomous expenditure:<br>A) has a positive relationship with
Q100: Planned investment is the:<br>A) spending households engage
Q101: A decrease in government spending would:<br>A) decrease
Q103: In a recession, the federal government may
Q104: The table shown displays the spending habits
Q105: Which of the following is not a
Q106: The figure shows planned aggregate expenditure and
Q107: When PAE decreases an economy will move