Multiple Choice
The data were collected from the heterocysts of a nitrogen-fixing cyanobacterium inhabiting equatorial ponds. Study the following graph and choose the most likely explanation for the shape of the curve.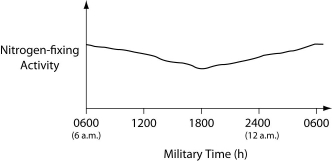
A) Enough O₂ enters heterocysts during hours of peak photosynthesis to have a somewhat-inhibitory effect on nitrogen fixation.
B) Light-dependent reaction rates must be highest between 1800 hours and 0600 hours.
C) Atmospheric N₂ levels increase at night because plants are no longer metabolizing this gas, so they are not absorbing this gas through their stomata.
D) Heterocyst walls become less permeable to N₂ influx during darkness.
E) The amount of fixed nitrogen that is dissolved in the pond water in which the cyanobacteria are growing peaks at the close of the photosynthetic day (1800 hours) .
Correct Answer:

Verified
Correct Answer:
Verified
Q6: Assuming that each of these possesses a
Q7: Carl Woese and collaborators identified two major
Q8: Which of the following is least associated
Q9: Which of the following traits do archaeans
Q10: Nitrogenase, the enzyme that catalyzes nitrogen fixation,
Q12: Chloramphenicol is an antibiotic that targets prokaryotic
Q13: In Fred Griffith's experiments, harmless R strain
Q14: If archaeans are more closely related to
Q15: Use the information in the following paragraph
Q16: The following questions refer to Figure 27.1.<br>In