Multiple Choice
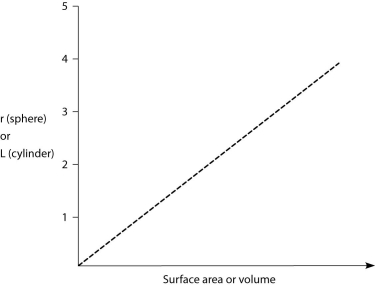
-Both axes of the graph are linear. Thus, the shape of the line plotted on this graph most accurately depicts the
A) volume of a sphere as the radius, r, increases.
B) surface area of a sphere as the radius, r, increases.
C) volume of a cylinder as length, L, increases.
D) surface area of a cylinder as length, L, increases.
Correct Answer:

Verified
Correct Answer:
Verified
Q38: Which feature seen in chytrids supports the
Q39: The hydrolytic digestion of which of the
Q40: Which of these paired fungal structures are
Q41: The following figure depicts the outline of
Q42: Which of the following best describes the
Q44: A researcher took water in which a
Q45: The fact that infection by Bd causes
Q46: Please refer to the following information to
Q47: Which description does not apply equally well
Q48: Plasmogamy can directly result in which of