Multiple Choice
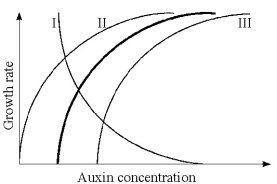
Figure 39.1
-The heavy line in Figure 39.1 illustrates the relationship between auxin concentration and cell growth
In stem tissues. If the same range of concentrations were applied to lateral buds, what curve(s) would probably be produced?
A) I
B) II
C) III
D) II or III
E) I or III
Correct Answer:

Verified
Correct Answer:
Verified
Q89: Which of the following plant growth responses
Q90: Which of the following plant hormones are
Q91: Which of the following is currently the
Q92: The rapid leaf movements resulting from a
Q93: In cases where plants exhibit generalized defense
Q95: Plant hormonal control differs from animal hormonal
Q96: Which of the following would only be
Q97: If the range of a species of
Q98: A botanist exposed two groups of the
Q99: Which of the following conclusions is supported