Multiple Choice
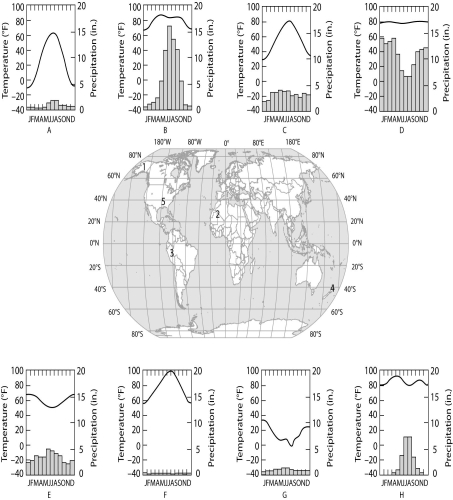
The eight climographs below show yearly temperature (line graph and left vertical axis) and precipitation (bar graph and right vertical axis) averages for each month for some locations on Earth. Choose the climograph that best answers the question or completes the statement. Climographs may be used once, more than once, or not at all.

-Which climograph shows the climate for location 3?
A) B
B) C
C) D
D) E
E) F
Correct Answer:

Verified
Correct Answer:
Verified
Q32: If global warming continues at its present
Q33: In mountainous areas of western North America,
Q34: Air masses formed over the Pacific Ocean
Q35: What would be the effect on climate
Q36: The eight climographs below show yearly temperature
Q38: Which of the following are important biotic
Q39: The diagram shows a generalized cross section
Q40: Imagine that a deep temperate zone lake
Q41: When climbing a mountain, we can observe
Q42: Which of the following areas of study