Multiple Choice
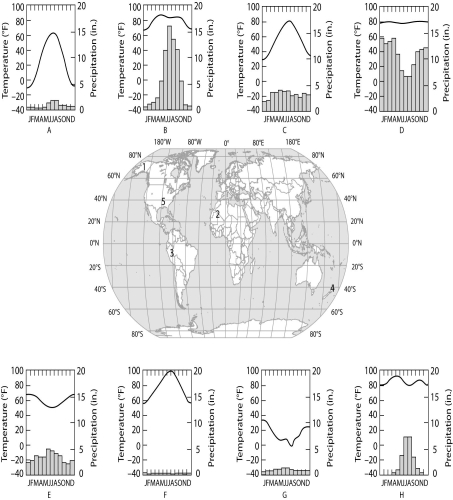
The eight climographs below show yearly temperature (line graph and left vertical axis) and precipitation (bar graph and right vertical axis) averages for each month for some locations on Earth. Choose the climograph that best answers the question or completes the statement. Climographs may be used once, more than once, or not at all.

-Which of the following best substantiates why location 3 is an equatorial (tropical) climate?
A) It has a monsoon season during the winter months.
B) It has consistent monthly averages for rainfall.
C) The temperature is high for each monthly average.
D) The temperatures reach 100°F during some months.
E) The temperatures are lower in June, July, and August.
Correct Answer:

Verified
Correct Answer:
Verified
Q61: Use this description to answer the following
Q62: Which statement about dispersal is false?<br>A) Dispersal
Q63: The diagram shows a generalized cross section
Q64: Which statement describes how climate might change
Q65: Which lake zone would be absent in
Q67: As climate changes because of global warming,
Q68: Which of the following choices includes all
Q69: Which of the following is characteristic of
Q70: Which of the following investigations would shed
Q71: Why is the climate drier on the