Multiple Choice
Which of the following graphs illustrates the growth curve of a small population of rodents that has grown to reach a static carrying capacity?
A) 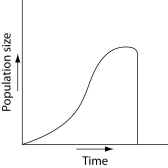
B) 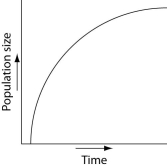
C) 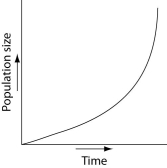
D) 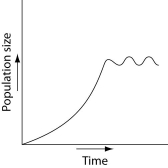
E) 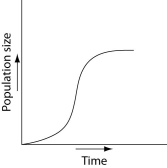
Correct Answer:

Verified
Correct Answer:
Verified
Related Questions
Q6: Use the survivorship curves in Figure 53.1
Q7: A population of white-footed mice becomes severely
Q8: A recent study of ecological footprints concluded
Q9: Which of the following sets of measurements
Q10: Which pair of terms most accurately describes
Q12: Please read the paragraph below and review
Q13: Which of the following best defines a
Q14: Which of the following is the best
Q15: Use the survivorship curves in Figure 53.1
Q16: Which pattern of reproduction is correctly paired