Short Answer
Which of the following graphs best describes the temperature in a large North American city over the course of a year? 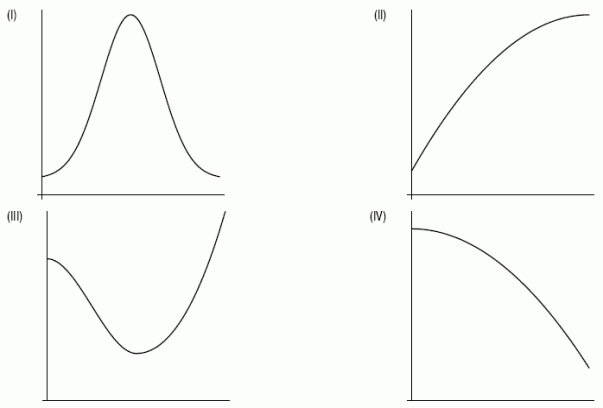
Correct Answer:

Verified
Correct Answer:
Verified
Related Questions
Q98: Bees and flowers help each other, and
Q99: For a new strain of the flu,
Q100: Find the solution to the differential equation
Q101: Look at the slope field labeled I.
Q102: The logistic model for a population's growth
Q104: What is the general solution of <img
Q105: Find the general solution of the separable
Q106: Water is being pumped into a pool
Q107: You invest $2,500 in your nephew's catering
Q108: Solve the differential equation using separation of