Short Answer
Which of the following graphs best describes the population of a species that is introduced to a confined space?
I. 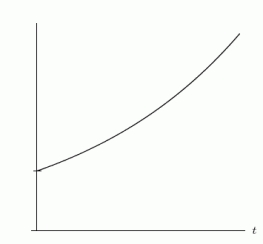 II.
II. 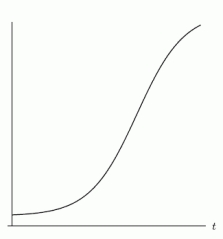 III.
III. 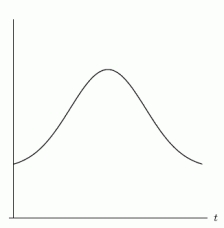 IV.
IV. 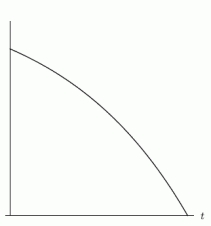
Correct Answer:

Verified
Correct Answer:
Verified
Q75: Find a solution to the differential equation
Q76: Does <img src="https://d2lvgg3v3hfg70.cloudfront.net/TB8190/.jpg" alt="Does satisfy
Q77: If <img src="https://d2lvgg3v3hfg70.cloudfront.net/TB8190/.jpg" alt="If is
Q78: Trout are introduced into a stream. Trout
Q79: The body of a murder victim is
Q81: Consider the differential equation <img src="https://d2lvgg3v3hfg70.cloudfront.net/TB8190/.jpg" alt="Consider
Q82: A manufacturer of a chocolate beverage mixes
Q83: A quantity Q satisfies the differential equation
Q84: Trout are introduced into a stream. Trout
Q85: Suppose <img src="https://d2lvgg3v3hfg70.cloudfront.net/TB8190/.jpg" alt="Suppose satisfies