Multiple Choice
Which of the following describes the contour diagram for the function 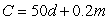 (with m on the vertical axis and d on the horizontal axis) ?
A) A set of parallel lines, all with slopes -250
B) A set of parallel lines, all with slopes 10
C) A set of parallel lines, all with slopes -0.004
D) A set of parallel lines, all with slopes 50
Correct Answer:

Verified
Correct Answer:
Verified
Q43: You build a campfire while up in
Q44: A mop company can produce <img src="https://d2lvgg3v3hfg70.cloudfront.net/TB8190/.jpg"
Q45: The following is a contour diagram for
Q46: If <img src="https://d2lvgg3v3hfg70.cloudfront.net/TB8190/.jpg" alt="If ,
Q47: The monthly mortgage payment in dollars, P,
Q49: A company sells two products. The fixed
Q50: Estimate f<sub>y</sub> (3,2) from the contour diagram
Q51: The amount, <img src="https://d2lvgg3v3hfg70.cloudfront.net/TB8190/.jpg" alt="The amount,
Q52: Use Lagrange multipliers to find the maximum
Q53: The function <img src="https://d2lvgg3v3hfg70.cloudfront.net/TB8190/.jpg" alt="The function