Multiple Choice
Let 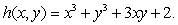 Which figure best represents the contours of this function?
A) 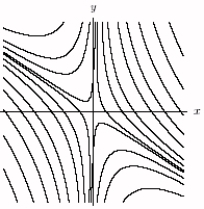
B) 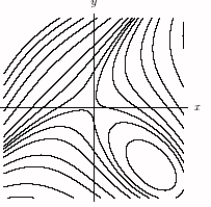
C) 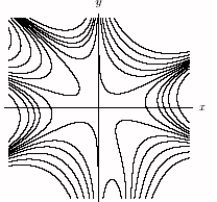
D) 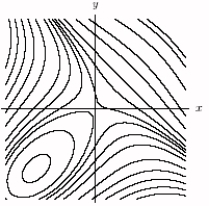
Correct Answer:

Verified
Correct Answer:
Verified
Related Questions
Q100: The following table shows the revenue R,
Q101: The amount, <img src="https://d2lvgg3v3hfg70.cloudfront.net/TB8190/.jpg" alt="The amount,
Q102: A television salesman earns a fixed salary
Q103: The table below gives values of a
Q104: A company has two manufacturing plants which
Q106: Use the values of <img src="https://d2lvgg3v3hfg70.cloudfront.net/TB8190/.jpg" alt="Use
Q107: The contour diagram of f is shown
Q108: A manufacturer sells two products. The first
Q109: A company sells two products. The fixed
Q110: For <img src="https://d2lvgg3v3hfg70.cloudfront.net/TB8190/.jpg" alt="For ,