Short Answer
Which of the following contour diagrams is more likely to show the population density of a region of a small town where the center of the diagram is the town center?
I.  II.
II. 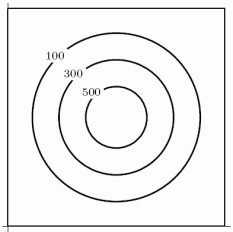
Correct Answer:

Verified
Correct Answer:
Verified
Related Questions
Q124: For <img src="https://d2lvgg3v3hfg70.cloudfront.net/TB8190/.jpg" alt="For ,
Q125: The following table shows the revenue R,
Q126: The amount of principal, $P, needed to
Q127: Below is a contour diagram depicting D,
Q128: The production function for a company is
Q129: Is (0, 0) a critical point of
Q130: A television salesman earns a fixed salary
Q131: A company operates two plants that make
Q132: Suppose <img src="https://d2lvgg3v3hfg70.cloudfront.net/TB8190/.jpg" alt="Suppose .
Q134: The quantity, Q, of a good produced