Multiple Choice
A density function for the lifetime of a certain type of frog is shown in the following figure. Which is the frog's lifetime more likely to be between? 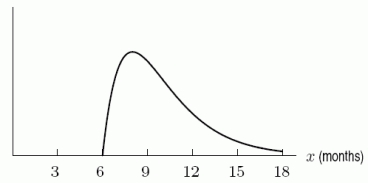
A) 7 and 8 months
B) 10 and 11 months
C) 13 and 14 months
Correct Answer:

Verified
Correct Answer:
Verified
Q38: Suppose <img src="https://d2lvgg3v3hfg70.cloudfront.net/TB8190/.jpg" alt="Suppose is
Q39: The speed of cars on a freeway
Q40: Let <img src="https://d2lvgg3v3hfg70.cloudfront.net/TB8190/.jpg" alt="Let be
Q41: The lifespan of a bug is approximately
Q42: Suppose scores from a standardized test measure
Q44: The density function f(x) shown below describes
Q45: The density function for the height of
Q46: The annual rainfall for a desert city
Q47: The probability of a plant surviving t
Q48: A professor far away from here gives