Short Answer
The following figure is a graph of a derivative function,  . Indicate on the graph the x-values that are critical points and label each as a local maximum, a local minimum, or neither.
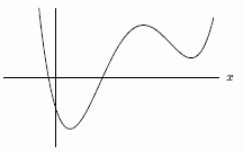
Correct Answer:

Verified
Correct Answer:
Verified
Q57: The Revenue is given by <img src="https://d2lvgg3v3hfg70.cloudfront.net/TB8190/.jpg"
Q58: The function <img src="https://d2lvgg3v3hfg70.cloudfront.net/TB8190/.jpg" alt="The function
Q59: A water park finds that at an
Q60: The number of plants in a terrarium
Q61: Find a value of a such that
Q63: If the cost function is <img src="https://d2lvgg3v3hfg70.cloudfront.net/TB8190/.jpg"
Q64: The total revenue, R, in dollars,when selling
Q65: Rank the following products from 1 to
Q66: If <img src="https://d2lvgg3v3hfg70.cloudfront.net/TB8190/.jpg" alt="If for
Q67: Total cost and revenue are approximated by