Not Answered
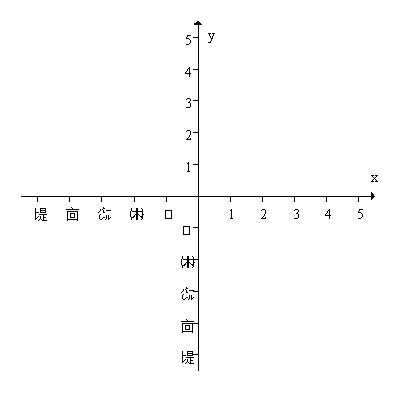
Sketch a graph of a function such that  at x = -1,
  > 0 when x< -1,
  > 0 when x > -1.
Correct Answer:

Verified
Correct Answer:
Verified
Related Questions
Q76: On the following graph, the point (4,3.5)
Q77: The peak concentration of 9 ng/ml for
Q78: An amusement park finds that when it
Q79: The average cost per item to produce
Q80: If time, t, is in hours and
Q82: The cost of producing q items is
Q83: For <img src="https://d2lvgg3v3hfg70.cloudfront.net/TB8190/.jpg" alt="For and
Q84: Find all of the critical points of
Q85: If the total revenue and total cost
Q86: Given the curve <img src="https://d2lvgg3v3hfg70.cloudfront.net/TB8190/.jpg" alt="Given the