Short Answer
The graph of a cost function is given in the following figure. Estimate the value of q at which average cost is minimized. 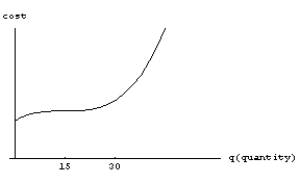
Correct Answer:

Verified
Correct Answer:
Verified
Related Questions
Q84: Find all of the critical points of
Q85: If the total revenue and total cost
Q86: Given the curve <img src="https://d2lvgg3v3hfg70.cloudfront.net/TB8190/.jpg" alt="Given the
Q87: If time, t, is in hours and
Q88: The demand equation for a product is
Q89: With x people aboard, a South African
Q90: Given <img src="https://d2lvgg3v3hfg70.cloudfront.net/TB8190/.jpg" alt="Given .
Q91: The following table shows the total sales,
Q93: The following table gives the concentration C,
Q94: The average cost per item to produce