Multiple Choice
The total revenue and cost curves for a product are shown in the following figure. Estimate the production level P that maximizes profit. 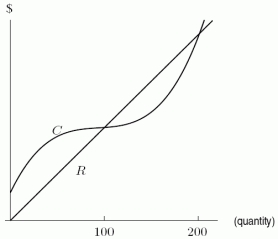
A) 50
B) 100
C) 150
D) 200
Correct Answer:

Verified
Correct Answer:
Verified
Related Questions
Q51: Classify the following graph as a probable
Q52: The following table gives the number of
Q53: For <img src="https://d2lvgg3v3hfg70.cloudfront.net/TB8190/.jpg" alt="For and
Q54: You sell hot dogs at a baseball
Q55: If time, t, is in hours and
Q57: The Revenue is given by <img src="https://d2lvgg3v3hfg70.cloudfront.net/TB8190/.jpg"
Q58: The function <img src="https://d2lvgg3v3hfg70.cloudfront.net/TB8190/.jpg" alt="The function
Q59: A water park finds that at an
Q60: The number of plants in a terrarium
Q61: Find a value of a such that