Multiple Choice
To study traffic flow along a major road, the city installs a device at the edge of the road at 4:00 am. The device counts the cars driving past, and records the total periodically. The resulting data is plotted on a graph, with time (in hours) on the horizontal axis and the number of cars on the vertical axis. The graph is shown below. It is a graph of the function  = Total number of cars that have passed by after t hours. When is the traffic flow the greatest?
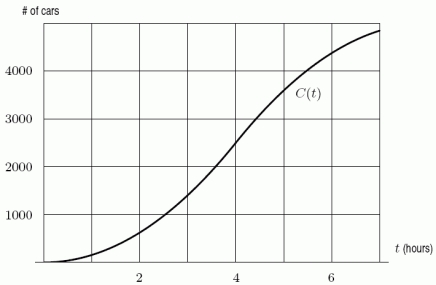
A) At t=6 hours.
B) At t=3 hours.
C) At t=4 hours.
D) At t=5 hours.
Correct Answer:

Verified
Correct Answer:
Verified
Q24: Cost and revenue functions for a certain
Q25: To produce 250 items the total cost
Q26: Given the following data about the function
Q27: Assume that f and g are differentiable
Q28: A certain bacterial colony was observed for
Q30: The cost of mining a ton of
Q31: The following table gives the cost and
Q32: Consider the two functions shown below. A.
Q33: A certain bacterial colony was observed for
Q34: Recently Esther swam a lap in an