Multiple Choice
The following figure shows the demand and supply curves for a product. Estimate the equilibrium quantity. 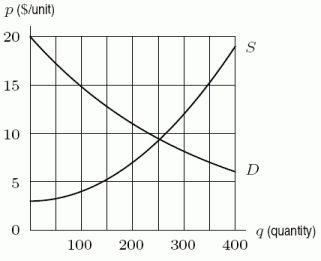
A) 0
B) 140
C) 250
D) 400
Correct Answer:

Verified
Correct Answer:
Verified
Q24: Propellant is leaking out from the pressurized
Q25: Supply and demand curves for a product
Q26: Supply and demand data are given in
Q27: Find a possible antiderivative of <img src="https://d2lvgg3v3hfg70.cloudfront.net/TB8190/.jpg"
Q28: The following figure shows the graph of
Q30: Find <img src="https://d2lvgg3v3hfg70.cloudfront.net/TB8190/.jpg" alt="Find .
Q31: If <img src="https://d2lvgg3v3hfg70.cloudfront.net/TB8190/.jpg" alt="If converges,
Q32: A young couple wants to start a
Q33: Find the indefinite integral <img src="https://d2lvgg3v3hfg70.cloudfront.net/TB8190/.jpg" alt="Find
Q34: This figure shows the rate of change