Multiple Choice
The following figure shows the demand and supply curves for a product. Estimate the consumer surplus. 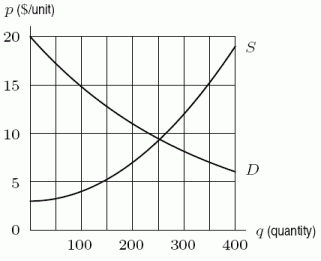
A) $1125
B) $1000
C) $400
D) $875
Correct Answer:

Verified
Correct Answer:
Verified
Q94: Choose the function that would correspond to
Q95: Evaluate <img src="https://d2lvgg3v3hfg70.cloudfront.net/TB8190/.jpg" alt="Evaluate .
Q96: Supply and demand curves for a medical
Q97: Find an antiderivative <img src="https://d2lvgg3v3hfg70.cloudfront.net/TB8190/.jpg" alt="Find an
Q98: Evaluate <img src="https://d2lvgg3v3hfg70.cloudfront.net/TB8190/.jpg" alt="Evaluate .
Q100: Suppose <img src="https://d2lvgg3v3hfg70.cloudfront.net/TB8190/.jpg" alt="Suppose and
Q101: Evaluate <img src="https://d2lvgg3v3hfg70.cloudfront.net/TB8190/.jpg" alt="Evaluate .
Q102: Given the graph: <img src="https://d2lvgg3v3hfg70.cloudfront.net/TB8190/.jpg" alt="Given the
Q103: Find <img src="https://d2lvgg3v3hfg70.cloudfront.net/TB8190/.jpg" alt="Find .
Q104: The improper integral <img src="https://d2lvgg3v3hfg70.cloudfront.net/TB8190/.jpg" alt="The improper