Multiple Choice
The following figure shows the demand and supply curves for a product. Estimate the total gains from trade. 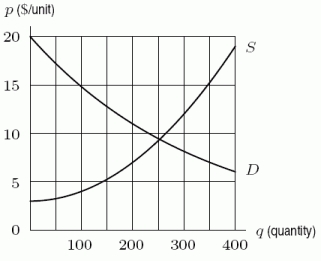
A) $1400
B) $2000
C) $1275
D) $2125
Correct Answer:

Verified
Correct Answer:
Verified
Q13: What is the present value of an
Q14: The supply and demand curves for a
Q15: Find <img src="https://d2lvgg3v3hfg70.cloudfront.net/TB8190/.jpg" alt="Find .
Q16: Suppose <img src="https://d2lvgg3v3hfg70.cloudfront.net/TB8190/.jpg" alt="Suppose and
Q17: Suppose <img src="https://d2lvgg3v3hfg70.cloudfront.net/TB8190/.jpg" alt="Suppose and
Q19: The graph of the derivative F' of
Q20: <img src="https://d2lvgg3v3hfg70.cloudfront.net/TB8190/.jpg" alt=" , where a
Q21: Given the following graph of <img src="https://d2lvgg3v3hfg70.cloudfront.net/TB8190/.jpg"
Q22: Use a definite integral to find the
Q23: Choose the function that would correspond to