Short Answer
Supply and demand curves for a product are shown in the following figure. Estimate the consumer surplus, to the nearest thousand dollars. 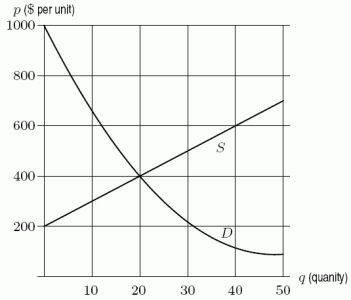
Correct Answer:

Verified
Correct Answer:
Verified
Q49: Find the indefinite integral <img src="https://d2lvgg3v3hfg70.cloudfront.net/TB8190/.jpg" alt="Find
Q50: From the time a child is born
Q51: Consider <img src="https://d2lvgg3v3hfg70.cloudfront.net/TB8190/.jpg" alt="Consider .
Q52: Given the following graph of <img src="https://d2lvgg3v3hfg70.cloudfront.net/TB8190/.jpg"
Q53: Evaluate <img src="https://d2lvgg3v3hfg70.cloudfront.net/TB8190/.jpg" alt="Evaluate ."
Q55: The following figure shows the demand and
Q56: The demand curve for a product has
Q57: Find <img src="https://d2lvgg3v3hfg70.cloudfront.net/TB8190/.jpg" alt="Find using
Q58: Evaluate <img src="https://d2lvgg3v3hfg70.cloudfront.net/TB8190/.jpg" alt="Evaluate .
Q59: Which of the following are appropriate for