Multiple Choice
The following figure is a graph of  . On which of the following intervals is f decreasing?
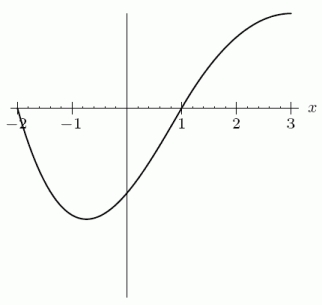
A) 
B) 
C) 
D) 
Correct Answer:

Verified
Correct Answer:
Verified
Q1: Use integration by parts to find <img
Q2: Evaluate <img src="https://d2lvgg3v3hfg70.cloudfront.net/TB8190/.jpg" alt="Evaluate .
Q4: Use integration by parts to find <img
Q5: Fuel pressure in the fuel tanks of
Q6: Evaluate <img src="https://d2lvgg3v3hfg70.cloudfront.net/TB8190/.jpg" alt="Evaluate .
Q7: Your company is downsizing and offers you
Q8: Use the Fundamental Theorem of Calculus to
Q9: Calculate <img src="https://d2lvgg3v3hfg70.cloudfront.net/TB8190/.jpg" alt="Calculate .
Q10: Given the values of <img src="https://d2lvgg3v3hfg70.cloudfront.net/TB8190/.jpg" alt="Given
Q11: Supply and demand curves for a product