Multiple Choice
The following graph represents the rate of change of a function f with respect to x; i.e., it is the graph of  , with
  . Which of the following are true at x = 1.8? (Check all that apply.)
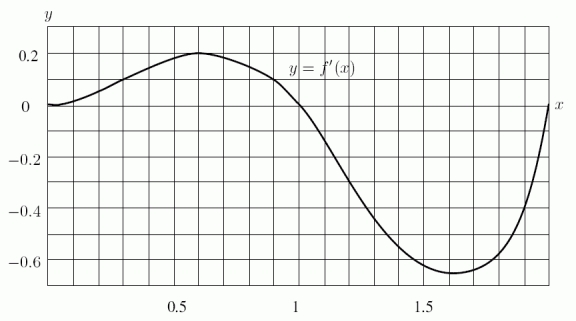
A) f is concave up
B) f is concave down
C) f is increasing
D) f is decreasing
Correct Answer:

Verified
Correct Answer:
Verified
Q64: Evaluate <img src="https://d2lvgg3v3hfg70.cloudfront.net/TB8190/.jpg" alt="Evaluate .
Q65: Find <img src="https://d2lvgg3v3hfg70.cloudfront.net/TB8190/.jpg" alt="Find using
Q66: Find the indefinite integral <img src="https://d2lvgg3v3hfg70.cloudfront.net/TB8190/.jpg" alt="Find
Q67: You are considering buying a salt water
Q68: Find <img src="https://d2lvgg3v3hfg70.cloudfront.net/TB8190/.jpg" alt="Find using
Q70: Use integration by parts to find <img
Q71: Find the indefinite integral <img src="https://d2lvgg3v3hfg70.cloudfront.net/TB8190/.jpg" alt="Find
Q72: At what constant, continuous annual rate should
Q73: The supply and demand curves for a
Q74: Given the following graph of <img src="https://d2lvgg3v3hfg70.cloudfront.net/TB8190/.jpg"