Short Answer
The following graph represents the rate of change of a function f with respect to x; i.e., it is the graph of  , with
  . Find a value a to one decimal place such that
  and
and  . If there is no such value, enter "none".
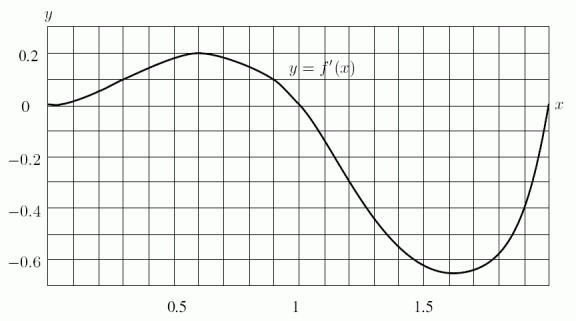
Correct Answer:

Verified
Correct Answer:
Verified
Q37: Evaluate <img src="https://d2lvgg3v3hfg70.cloudfront.net/TB8190/.jpg" alt="Evaluate .
Q38: A. Find the present value of an
Q39: If <img src="https://d2lvgg3v3hfg70.cloudfront.net/TB8190/.jpg" alt="If converges,
Q40: Find <img src="https://d2lvgg3v3hfg70.cloudfront.net/TB8190/.jpg" alt="Find .
Q41: Compute <img src="https://d2lvgg3v3hfg70.cloudfront.net/TB8190/.jpg" alt="Compute .
Q43: A family invests in a snow cone
Q44: Supply and demand curves for a product
Q45: Evaluate <img src="https://d2lvgg3v3hfg70.cloudfront.net/TB8190/.jpg" alt="Evaluate .
Q46: Find <img src="https://d2lvgg3v3hfg70.cloudfront.net/TB8190/.jpg" alt="Find A)
Q47: Find <img src="https://d2lvgg3v3hfg70.cloudfront.net/TB8190/.jpg" alt="Find A)