Multiple Choice
Below is a graph of the rate r in arrivals per minute at which students line up for breakfast. The first people arrive at 6:50 am and the line opens at 7:00 am. The line serves students at a constant rate of 20 students per minute. Estimate the rate at which the line is growing in length at 7:14 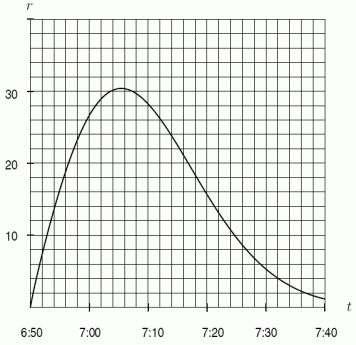
A) 3 people per minute
B) 4 people per minute
C) 8 people per minute
D) 24 people per minute
Correct Answer:

Verified
Correct Answer:
Verified
Q36: At time t, in seconds, the velocity
Q37: Data for a function G is given
Q38: Your rich eccentric friend has hired you
Q39: At time t, in seconds, your velocity,
Q40: If <img src="https://d2lvgg3v3hfg70.cloudfront.net/TB8190/.jpg" alt="If is
Q42: Suppose <img src="https://d2lvgg3v3hfg70.cloudfront.net/TB8190/.jpg" alt="Suppose and
Q43: The graph of <img src="https://d2lvgg3v3hfg70.cloudfront.net/TB8190/.jpg" alt="The graph
Q44: Consider the function <img src="https://d2lvgg3v3hfg70.cloudfront.net/TB8190/.jpg" alt="Consider the
Q45: If <img src="https://d2lvgg3v3hfg70.cloudfront.net/TB8190/.jpg" alt="If ,
Q46: The Ethnic food line at the Cougar