Multiple Choice
Below is a graph of the rate r in arrivals per minute at which students line up for breakfast. The first people arrive at 6:50 am and the line opens at 7:00 am. The line serves students at a constant rate of 20 students per minute. Estimate the length of time a person who arrives at 7:00 has to stand in line. 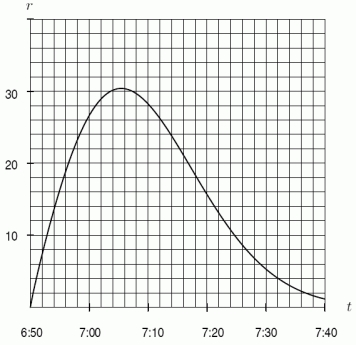
A) 1.5 minutes
B) 3.5 minutes
C) 7.5 minutes
D) 11.5 minutes
Correct Answer:

Verified
Correct Answer:
Verified
Q73: Find the area included between the curves
Q74: A stamp collector has 3000 stamps in
Q75: Use an integral to find the area
Q76: Consider a sports car which accelerates from
Q77: A shop is open from 9am-7pm. The
Q79: On a recently discovered planetoid, acceleration due
Q80: The marginal cost function of producing a
Q81: A local business produces souvenirs for the
Q82: The marginal cost function for a manufacturing
Q83: If the velocity function <img src="https://d2lvgg3v3hfg70.cloudfront.net/TB8190/.jpg" alt="If