Short Answer
A graph of  is given in the following figure.
A. What is  (to the nearest whole number)?
B. What is the range of the function? 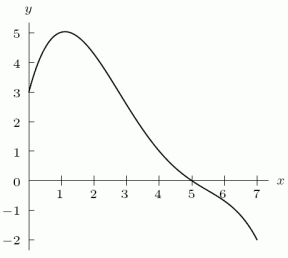
Correct Answer:

Verified
Correct Answer:
Verified
Related Questions
Q11: As <img src="https://d2lvgg3v3hfg70.cloudfront.net/TB8190/.jpg" alt="As ,
Q12: If the size of a bacteria colony
Q13: Using the table, find the value of
Q14: Write the function <img src="https://d2lvgg3v3hfg70.cloudfront.net/TB8190/.jpg" alt="Write the
Q15: The following table gives the number of
Q17: Give a formula for the following sinusoidal
Q18: One of the following tables of data
Q19: The following table gives the number of
Q20: A town has 2400 people initially. Find
Q21: Find the equation of the line passing