Short Answer
Harley Davidson (ticker symbol HOG) stock prices dropped sharply in late 2008. Series 1 in the graph below shows the actual prices at the end of each week. The trend over time is approximately linear; and the graph of a possible linear model is given by Series 2. Based on the data given, find the linear model and use it to approximate the stock's price on November 30, 2008, assuming the current trend continued. 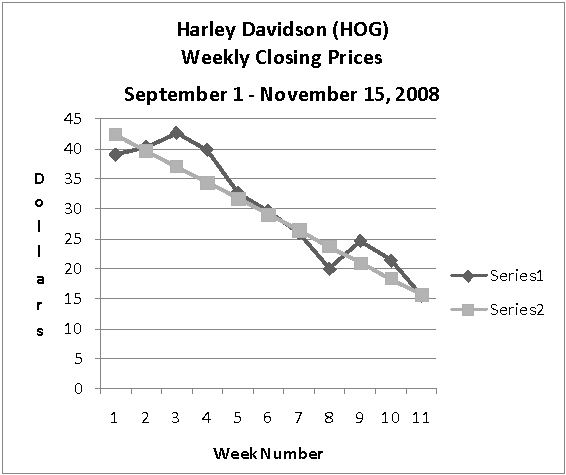
Correct Answer:

Verified
 and $12.0...
View Answer
Unlock this answer now
Get Access to more Verified Answers free of charge
Correct Answer:
Verified
View Answer
Unlock this answer now
Get Access to more Verified Answers free of charge
Q156: The cost of shipping r grams of
Q157: The population <img src="https://d2lvgg3v3hfg70.cloudfront.net/TB8190/.jpg" alt="The population
Q158: A town has 800 people initially. Find
Q159: As <img src="https://d2lvgg3v3hfg70.cloudfront.net/TB8190/.jpg" alt="As ,
Q160: A new species, introduced into an environment
Q162: Bank A offers 12% interest, compounded yearly,
Q163: The table gives information about the number
Q164: Solve <img src="https://d2lvgg3v3hfg70.cloudfront.net/TB8190/.jpg" alt="Solve for
Q165: Find the average rate of change of
Q166: A furniture moving company charges a fixed