Multiple Choice
One of the graphs below shows the rate of flow, R, of blood from the heart in a man who bicycles for 20 minutes, starting at t = 0 minutes. The other graph shows the pressure, p, in the artery leading to a man's lungs as a function of the rate of flow of blood from the heart. Estimate  .
. 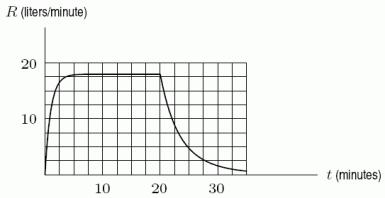
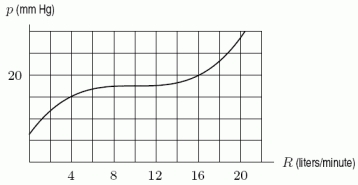
A) 15 mm Hg
B) 11 mm Hg
C) 19 mm Hg
D) 7 mm Hg
Correct Answer:

Verified
Correct Answer:
Verified
Q173: Given the function <img src="https://d2lvgg3v3hfg70.cloudfront.net/TB8190/.jpg" alt="Given the
Q174: If <img src="https://d2lvgg3v3hfg70.cloudfront.net/TB8190/.jpg" alt="If defines
Q175: A textbook company had fixed costs of
Q176: Lisinopril is an ACE inhibitor derived from
Q177: The population <img src="https://d2lvgg3v3hfg70.cloudfront.net/TB8190/.jpg" alt="The population
Q179: A school library opened in 1980. In
Q180: As <img src="https://d2lvgg3v3hfg70.cloudfront.net/TB8190/.jpg" alt="As ,
Q181: Do you expect the average rate of
Q182: A population is growing according to the
Q183: As <img src="https://d2lvgg3v3hfg70.cloudfront.net/TB8190/.jpg" alt="As ,