Short Answer
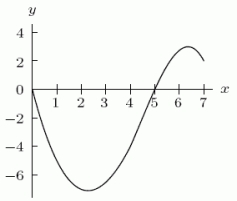
The graph of  is shown in the following figure. The ________ of
  is
is  , and the ________ of
  is
is  .
. 
Correct Answer:

Verified
Correct Answer:
Verified
Related Questions
Q30: Simplify the expression <img src="https://d2lvgg3v3hfg70.cloudfront.net/TB8190/.jpg" alt="Simplify the
Q31: If the graph of <img src="https://d2lvgg3v3hfg70.cloudfront.net/TB8190/.jpg" alt="If
Q32: Which could be a possible formula for
Q33: The following table gives the values for
Q34: Production costs for manufacturing T-shirts consist of
Q36: A car is worth $15,000 when it
Q37: Given the equation <img src="https://d2lvgg3v3hfg70.cloudfront.net/TB8190/.jpg" alt="Given the
Q38: Which could be a possible formula for
Q39: The average weight in pounds of American
Q40: Find a formula for the linear function