Short Answer
The graph of  is shown in the following figure. Estimate
  (to the nearest integer).
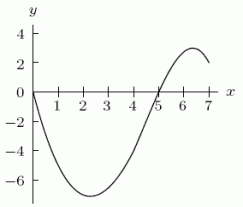
Correct Answer:

Verified
Correct Answer:
Verified
Related Questions
Q108: The distance <img src="https://d2lvgg3v3hfg70.cloudfront.net/TB8190/.jpg" alt="The distance
Q109: A teenager has $36 to spend at
Q110: An exponentially decaying substance was weighed every
Q111: A ball is thrown at time t
Q112: A company has cost and revenue functions
Q114: The size of a bird population on
Q115: Suppose that <img src="https://d2lvgg3v3hfg70.cloudfront.net/TB8190/.jpg" alt="Suppose that
Q116: Consider the functions <img src="https://d2lvgg3v3hfg70.cloudfront.net/TB8190/.jpg" alt="Consider the
Q117: The number of bacteria in milk grows
Q118: In the following graph, the minimum degree