Short Answer
The graph of  is shown in the following figure. Is the graph increasing or decreasing at x = 3?
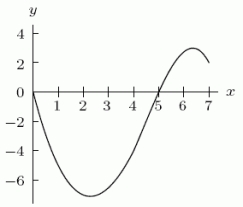
Correct Answer:

Verified
Correct Answer:
Verified
Related Questions
Q4: A bar of soap starts out weighing
Q5: Give a possible formula for the function
Q6: As <img src="https://d2lvgg3v3hfg70.cloudfront.net/TB8190/.jpg" alt="As ,
Q7: Identify the function defined in the following
Q8: A school library opened in 1980. In
Q10: Simplify <img src="https://d2lvgg3v3hfg70.cloudfront.net/TB8190/.jpg" alt="Simplify ,
Q11: As <img src="https://d2lvgg3v3hfg70.cloudfront.net/TB8190/.jpg" alt="As ,
Q12: If the size of a bacteria colony
Q13: Using the table, find the value of
Q14: Write the function <img src="https://d2lvgg3v3hfg70.cloudfront.net/TB8190/.jpg" alt="Write the