Multiple Choice
The graph below shows how the force on a 0.500 kg particle varies with position. If the particle has speed  at x = 0.00 m, what is its speed in m/s when x = 8.00 m?
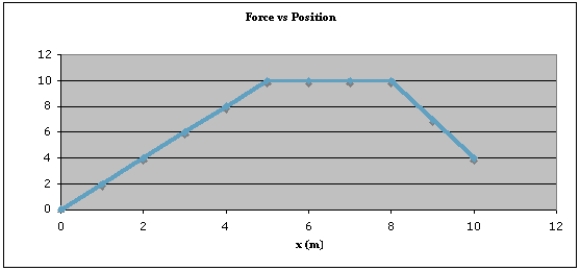
A) 2.00
B) 10.7
C) 14.8
D) 15.0
E) 21.1
Correct Answer:

Verified
Correct Answer:
Verified
Related Questions
Q57: A 2.0-kg block sliding on a frictionless
Q58: A moving particle is subject to conservative
Q59: If the scalar product of two vectors,
Q60: An object moving along the x axis
Q61: Two clowns are launched from the same
Q63: The force an ideal spring exerts on
Q64: A 2.0-kg block situated on a frictionless
Q65: A constant force of 15 N in
Q66: Negative work can be done<br>A) by friction
Q67: A 1.5-kg object moving along the x