Multiple Choice
The graph below represents a wave function ψ(x) for a particle confined to −4.00 m ≤ x ≤ +4.00 m. The magnitude of the normalization constant A is 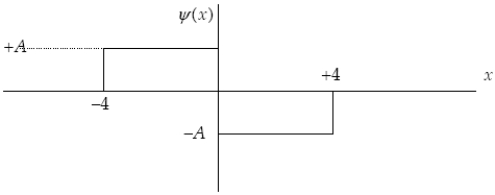
A)  .
.
B)  .
.
C)  .
.
D)  .
.
E) 4.
Correct Answer:

Verified
Correct Answer:
Verified
Related Questions
Q20: The average position, or expectation value, of
Q21: A particle is in the first excited
Q22: The ground state energy of a harmonic
Q23: If the interaction of a particle with
Q24: A particle is in the second excited
Q26: What is the quantum number n of
Q27: A particle in a finite potential well
Q28: The graph below represents a wave function
Q29: The wave function for a particle confined
Q30: The wave function for a particle in